Urbanization and climate change jointly shift land surface phenology in the northern mid-latitude large cities
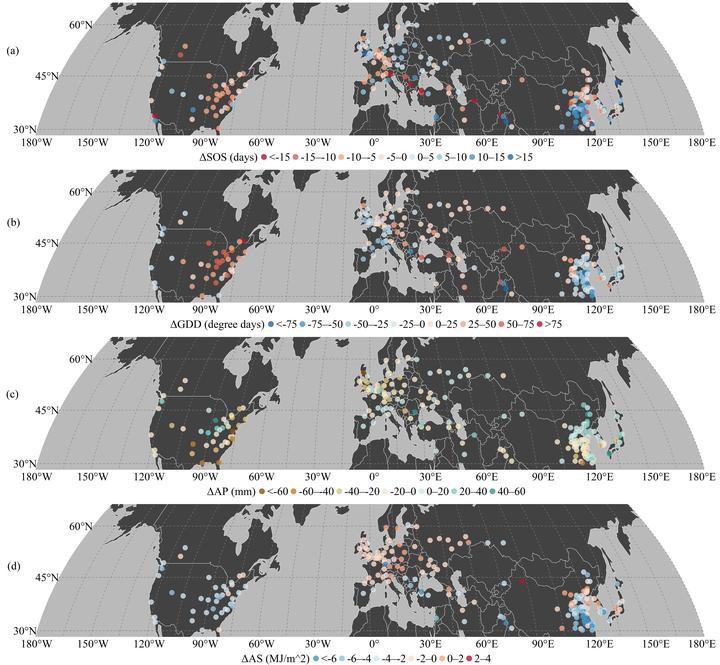 Title: Spatial patterns of changes from pre- to post-urbanization for each city. Each point represents the city-level zonal mean values. Specifically, a. changes in the start of season; b. changes in spring pre-season growing degree days; c. changes in spring pre-season accumulated precipitation; d. changes in spring pre-season accumulated insolation.
Abstract
Land surface phenology (LSP) has been widely used as the “footprint” of urbanization and global climate change. Shifts of LSP have cascading effects on food production, carbon sequestration, water consumption, biodiversity, and public health. Previous studies mainly focused on investigating the effects of urbanization on the spatial patterns of LSP by comparing phenological metrics, e.g. start of season (SOS) and end of season (EOS), between urban center and the surrounding rural regions. However, it remains unclear how urbanization-induced land cover conversions and climate change jointly influence the temporal variations of SOS and EOS within the urban ecosystem. To fill this knowledge gap, we utilized daily two-band enhanced vegetation index, daily meteorological record, and annual land cover dataset to investigate the respective impacts of urbanization and climate change on temporal shifts of LSP between the post- and the pre-urbanization periods over 196 large cities in the northern mid-latitudes. We found 51% of the cities experienced an advanced SOS with an average of -6.39 ± 5.82 days after urbanization has occurred, while the remaining 49% of the cities had a delayed SOS with an average of 7.56 ± 5.63 days. We also found a later EOS at 53% of the cities and an earlier EOS at 47% of the cities with an average of 8.43 ± 7.59 and -5.57 ± 4.99 days between the post- and pre-urbanization periods, respectively. Multiple linear regression analysis indicates that climate variables (i.e. temperature, precipitation, and insolation) play dominant roles in regulating the temporal shifts of LSP. Furthermore, the earlier SOS and later EOS were significantly correlated with the amplitude of urbanization (i.e. increase of impervious surface area) in cities after controlling for effects of climate factors. These patterns were generally consistent across eight climate zones. Our findings provide critical information in modeling natural and anthropogenic effects on urban ecosystem, with important benefits for urban sustainability and biodiversity conservation.
Research Highlights
- Post- and pre- urbanization periods were identified for 196 large cities
- Half of the cities experienced earlier SOS and delayed EOS after urbanization
- Climate change played a dominant role in regulating temporal shifts of phenology
- Urbanization can either amplified or off-set climate effects on phenology
- Influences of urbanization and climate change vary by climate background
Study Sites
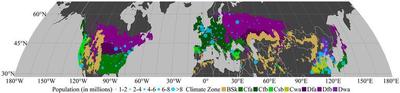
We selected 196 large cities (population larger than 1 million) in the northern mid-latitude within 8 Koopen-Geiger climate zones.
Key innovations
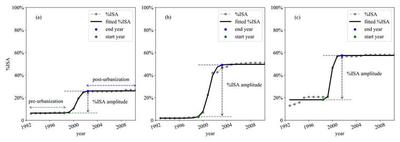
Many studies have reported an advanced SOS and a delayed EOS in the urban center compared to their rural surroundings. However, few studies were conducted on how urbanization-induced land cover conversions (i.e. increase of impervious surface area) altered the temporal patterns of vegetation phenology in the urban ecosystem through time in the context of climate change. In this study, we investigated the phenological shifts and explored their relationships with urbanization as well as climatic variations. The %ISA remains relatively stable within our identified pre- and post-urbanization time intervals, thus isolating the influences of urbanization and enabling us to examine the response of vegetation dynamics to climate change.