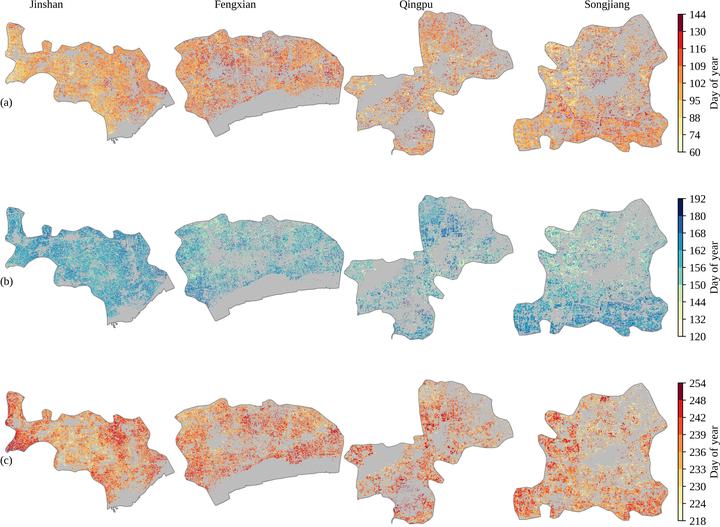
 Maps of long-term mean phenological metrics in the four counties of Shanghai. Each column in the figure indicates one of the four counties. (a) maps of peak of first cropping cycle (POS1). (b) maps of start of second cropping cycle (SOS2). (c) maps of peak of second cropping cycle (POS2). Gray regions represent missing data and non-crop areas.
Abstract
Cropland phenology provides key information in managing agricultural practices and modelling crop yield. However, most of the existing phenological products have coarse spatial resolution ranging from 250 to 8000 m, which is not sufficient to capture the critical spatial details of cropland phenology at the landscape scale. Landsat imagery provides an unprecedented data source to generate 30-m spatial resolution phenological products. This paper explored the potential of utilizing multi-year Landsat enhanced vegetation index to derive annual phenological metrics of a double-season agricultural land from 1993 to 2009 in a sub-urban area of Shanghai, China. We used all available Landsat TM and ETM+ observations (538 scenes) and developed a Landsat double-cropping phenology (LDCP) algorithm. LDCP captures the temporal trajectory of multi-year enhanced vegetation index time series very well, with the degree of fitness ranging from 0.78 to 0.88 over the study regions. We found good agreements between derived annual phenological metrics and in situ observation, with root mean square error ranging from 8.74 to 18.04 days, indicating that the proposed LDCP is capable of detecting double-season cropland phenology. LDCP could reveal the spatial heterogeneity of cropland phenology at parcel scales. Phenology metrics were retrieved for approximately one-third and two-thirds of the 17 years for the first and second cropping cycles, respectively, depending on the number of good quality Landsat data. In addition, we found an advanced peak of season for both cropping cycles in 50–60% of the study area, and a delayed start of season for the second cropping cycle in 50–70% of the same area. The potential drivers of those trends might be climate warming and changes in agricultural practices. The derived cropland phenology can be used to help estimate historical crop yields at Landsat spatial resolution, providing insights on evaluating the effects of climate change on temporal variations of crop growth, and contributing to food security policy making.
Research Highlights
- New algorithm for double-cropping phenology using Landsat
- Interannual variation in peak and start of season were related with climate change and land cover land use change
Key innovations
The phenological metrics derived from LDCP could provide critical information for timing of irrigation and fertilization usage, thus promoting cropland management and increasing food production. The LDCP has the potential to include other moderate spatial resolution instruments, such as Landsat OLI and Sentinel-2A/B Multispectral Instrument (MSI) [47], or images from high spatial resolution instruments, such as Cubesat [48], to monitor phenological changes at parcel to landscape scales. LDCP can also be used to fully examine the individual and interactive effects of climate change and agricultural management on cropland phenology, given fine grain size climate data that matches with the spatial resolution of Landsat imagery.